
History of Atlases
The first serious attempt at mapping the distribution of birds in Britain and Ireland was made by the late Tony Norris. He organised a pilot project to map the distribution of 100 species in the West Midlands in 1950 and this was followed up in 1952 by a survey using the 25 x 25 km National Grid squares that mapped the distribution of 30 species in Britain and Ireland (Norris 1960).
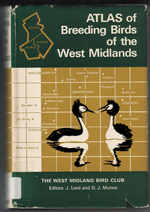
The West Midland Bird Club pioneered the use of 10-km squares and tetrads for bird recording purposes with the publication of the Atlas of the Breeding Birds in the West Midlands (Lord & Munns 1970). This was the first bird atlas to be produced in Britain and Ireland.
Inspired by the work of Tony Norris, BTO Council discussed for over two years the possibility of an Atlas of Breeding Birds. In September 1967 an Atlas Working Group was formed and plans were made for the first national atlas to map the distribution of birds in the breeding season. This atlas also was modelled on the Botanical Society of the British Isles’ Atlas of the British Flora (Perring & Walter 1962).

The Atlas of Breeding Birds in Britain and Ireland was organised by the British Trust for Ornithology (BTO) and Irish Wildbird Conservancy (IWC) and organised by Tim Sharrock (Sharrock 1976). It was estimated that 10,000-15,000 observers contributed, resulting in dot-distribution maps with the size of dot representing levels of breeding evidence (possible, probable and confirmed). It was a giant step forward in our knowledge of the distribution of British and Irish birds.
The aim in covering a square was to record every species breeding in it during 1968–72 and, if possible, to prove breeding for each one. To this end, the main guidance given to observers was that they should visit samples of every different habitat in the square during the main breeding season of April to July, to make visits outside this period for certain species (e.g. in February or March for owls) and to make dusk and night visits for crepuscular and nocturnal species.
We were fortunate that two other national breeding bird surveys coincided or overlapped with the BTO/IWC Atlas project. First, the Wildfowl Trust's survey of breeding and summering wildfowl in Britain, covering 1965–70, was also based on 10-km squares. Secondly, the Seabirds Group's 'Operation Seafarer', the aim of which was to obtain counts and estimates of all seabirds breeding in Britain and Ireland, was carried out mainly in 1969–70.
The three grades of evidence of breeding - possible, probably and confirmed - are shown on the maps in the book as three increasing sizes of dots. The absence of a dot indicated that the species was not reported in suitable breeding habitat during the breeding seasons of 1968–72. Such blank areas will often accurately reflect the species' absence, but this cannot be assumed, as it is only in certain cases that truly negative records can be obtained. It is usually safe to assume, however, that the species is not common in such blank square
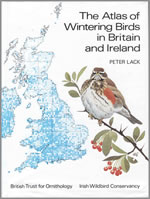
The second atlas was The Atlas of Wintering Birds in Britain and Ireland (Lack 1986). The late Peter Grant first mooted the possibility of a Winter Atlas in 1977 and by May 1980 a Working Group had been set up and pilot fieldwork planned for 1980/81. The successful partnership of the BTO and IWC continued, and under the guidance of the National Organiser, Peter Lack, fieldwork was carried out over three winters 1981/82 – 1983/84.
The methods were as follows. Two kinds of records were accepted: first, the results of visits made to 10-km squares specifically to do fieldwork for the Winter Atlas; and second, any casual records (termed Supplementary Records) of individual species. For a specific visit, observers were asked to spend a minimum of one hour in a 10-km square and to count the number of birds of each species seen and/or heard. Only records of birds actually seen or heard were wanted, not those which observers 'knew' to be present. Therefore provision had to be made for the recording of birds at times other than during a special visit. For such records observers filled in a Supplementary Record Sheet.
After analysis and discussion of the results of the pilot Survey, it was decided to use as the assessment of abundance 'the number of birds seen in a day'. It was further decided that if there was more than one count of a species in a square the highest figure would be used. A 'day' was defined as six hours in the field, this being the longest that most observers would be likely to be able to devote to fieldwork in a day. In fact only about 3.5% of all cards received were for periods longer than this. All timed counts of more or less than six hours were standardised to this standard 'day length'. This was to permit better comparisons of areas which might have counts of only one or two hour duration with those which had six-hour counts. The species maps produced in the book used three sizes of dot, the larger dots indicating more birds. On the website, sizes are replaced with colours. The divisions between the different dot values were chosen so that 50% of the dots were in the lowest category, 30% in the middle category and 20% in the highest category, and the divisions were made to the nearest whole number of birds.
In total, 3,761 10-km squares received an average of 16 visits, representing nearly 180,000 hours by over 10,000 observers. The maps show three level of dot size representing different levels of numbers of birds seen in a day. Our knowledge of the distribution of birds in winter was very poor compared with the breeding season and this winter atlas provided a baseline for all future work.

The third atlas to be carried out was The New Atlas of Breeding Birds in Britain and Ireland (Gibbons et al. 1994). The BTO and IWC joined forces with the Scottish Ornithologists’ Club, and appointed David Gibbons, James Reid and Robert Chapman as National Organisers. Fieldwork for the New Atlas was conducted between April 1st and July 31st in each of the four years 1988–91. Initially, it had been hoped that coverage would be complete in three years, but this proved impossible and the survey eventually occupied four seasons. Fieldwork was coordinated by a network of volunteer regional organisers and was undertaken by members of the BTO, SOC, IWC and others (again mostly volunteers) who followed a set of instructions issued prior to the beginning of each breeding season, in brief, the instructions were as follows. Observers visited, either alone or as a coordinated team, a minimum of eight tetrads of their own choice within each 10-km square. Two hours were spent in each tetrad, and a species list was compiled for each. From these timed visits an index of abundance of each species in each square was calculated. Additional supplementary (non-timed) observations were also requested, to ensure that the species lists for each 10-km square were as complete as possible.
A total of 551,370 10-km square records was submitted to the Atlas. These were based on 320,595 records collected during time tetrad visits, and 230,775 supplementary records. The 10-km square timed visit records were themselves based on 1,262,231 tetrad records from 42,736 tetrads (34,601 in Britain, The Channel Islands and the Isle of Man, and 8,135 in Ireland) in 3,672 10-km squares (2,720 in Britain, the Channel Islands and the Isle of Man, and 952 in Ireland).
This atlas showed three different types of map. The distribution maps had two different dot sizes: a large dot referred to a 10-km square with evidence of breeding (the ‘breeding’ category; see Introduction and Methods). A small dot referred to presence during the breeding season, but with no stronger evidence of breeding (the ‘seen’ category). These data came from both timed and non-timed observations, and thus did not take into account variation in observer effort. Only 10-km squares with evidence of breeding were presented for seabirds (see Introduction and Methods). All dots were placed centrally with each 10-km square and for coastal squares may have occasionally falled in the sea.
The change map documented the recorded change in distribution between 1968–72 and 1988–91. The maps produced in the book used four different types of dot, the definitions of which were as follows:
Small open dot = possible breeding in 1968–72, not recorded in 1988–91
Large open dot = probably or confirmed breeding in 1968–72, not recorded in 1988–91.
Small filled dot = not recorded in 1968–72 but present, although no evidence of breeding, in 1988–91.
Large filled dot = not recorded in 1968–72, but evidence of breeding in 1988–91.
The third type of map showed variation in relative abundance across Britain and Ireland. For the majority of species these maps were based on the proportion of tetrads in which a species was detected during timed visits. This information was spatially smoothed to generate coloured contour maps.
The distribution maps from these landmark publications, and the changes apparent between them and Bird Atlas 2007–11, have been combined into a new online "Mapstore" which can be accessed from the Results menu.
References
Gibbons, D.W., Reid, J.B. & Chapman, R.A. 1993. The New Atlas of Breeding Birds in Britain and Ireland: 1988–1991. T. & A.D. Poyser, London.
Lack, P. C. 1986. The Atlas of Wintering Birds in Britain and Ireland. T. & T. A. Poyser,Calton.
Lord, J. & Munns, D.J. 1970. Atlas of Breeding Birds in the West Midlands. London.
Norris, C.A. 1960. The breeding distribution of thirty bird species in 1952. Bird Study 7: 129-184.
Perring, F.H. & Walters, S.M. 1962. Atlas of the British Flora. BSBI London & Edinburgh.
Sharrock, J. T. R. 1976. The Atlas of Breeding Birds in Britain and Ireland. T. & A. D. Poyser, Berkhamsted.


Share this page