Why a new Bird Atlas?
The simple answer to this question is that bird distributions are in constant flux. A range of information, from the structured surveys of breeding birds (e.g. the Breeding Bird Survey ), to casual observations of the arrival of new breeding species (e.g. BirdTrack ), tell us that the status of species are changing, so there is a need to revise distribution maps, and by comparison with previous atlases, quantify change.
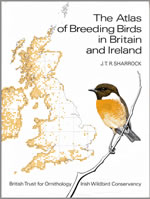
The great value of atlases is their comprehensive coverage - the British and Irish atlases have covered all parts of the countries and all species. Such a mammoth effort can only be undertaken periodically and there is a general plan within Britain and Ireland to produce breeding atlases every 20 years. With previous breeding atlases in 1968–72 and 1988–91, another was due in 2008–11, and the decision was taken to double-up on organisational effort and pair this with a winter atlas covering the period 2007/08–2010/11.
Though a worthy goal, the production of an atlas isn’t an end in itself because the underlying data have many additional uses. In the absence of contemporary information, BTO researchers and others continued to use data from 1988–91 but they were desperately keen to see updated distribution information, for example to test the effectiveness of agri-environment schemes or to measure the ongoing impacts of climate change. Conservationists were keen to have the latest distribution information to better target management at dwindling populations and to identify critical areas for protection. With Bird Atlas 2007–11 now completed, BTO and BirdWatch Ireland are working hard to make the atlas data as productive as possible for research and conservation.



Share this page